pix: an AI agent that publishes one chart a day
Every morning at 8:05 Eastern, a Claude Code scheduled task starts a fresh session, reads a brief I wrote, and publishes one visual analysis of the world to pix. It picks the topic, finds and downloads the data, writes the analysis in Python, draws the chart, writes a short post, and pushes it all to GitHub. Nobody touches it in between.
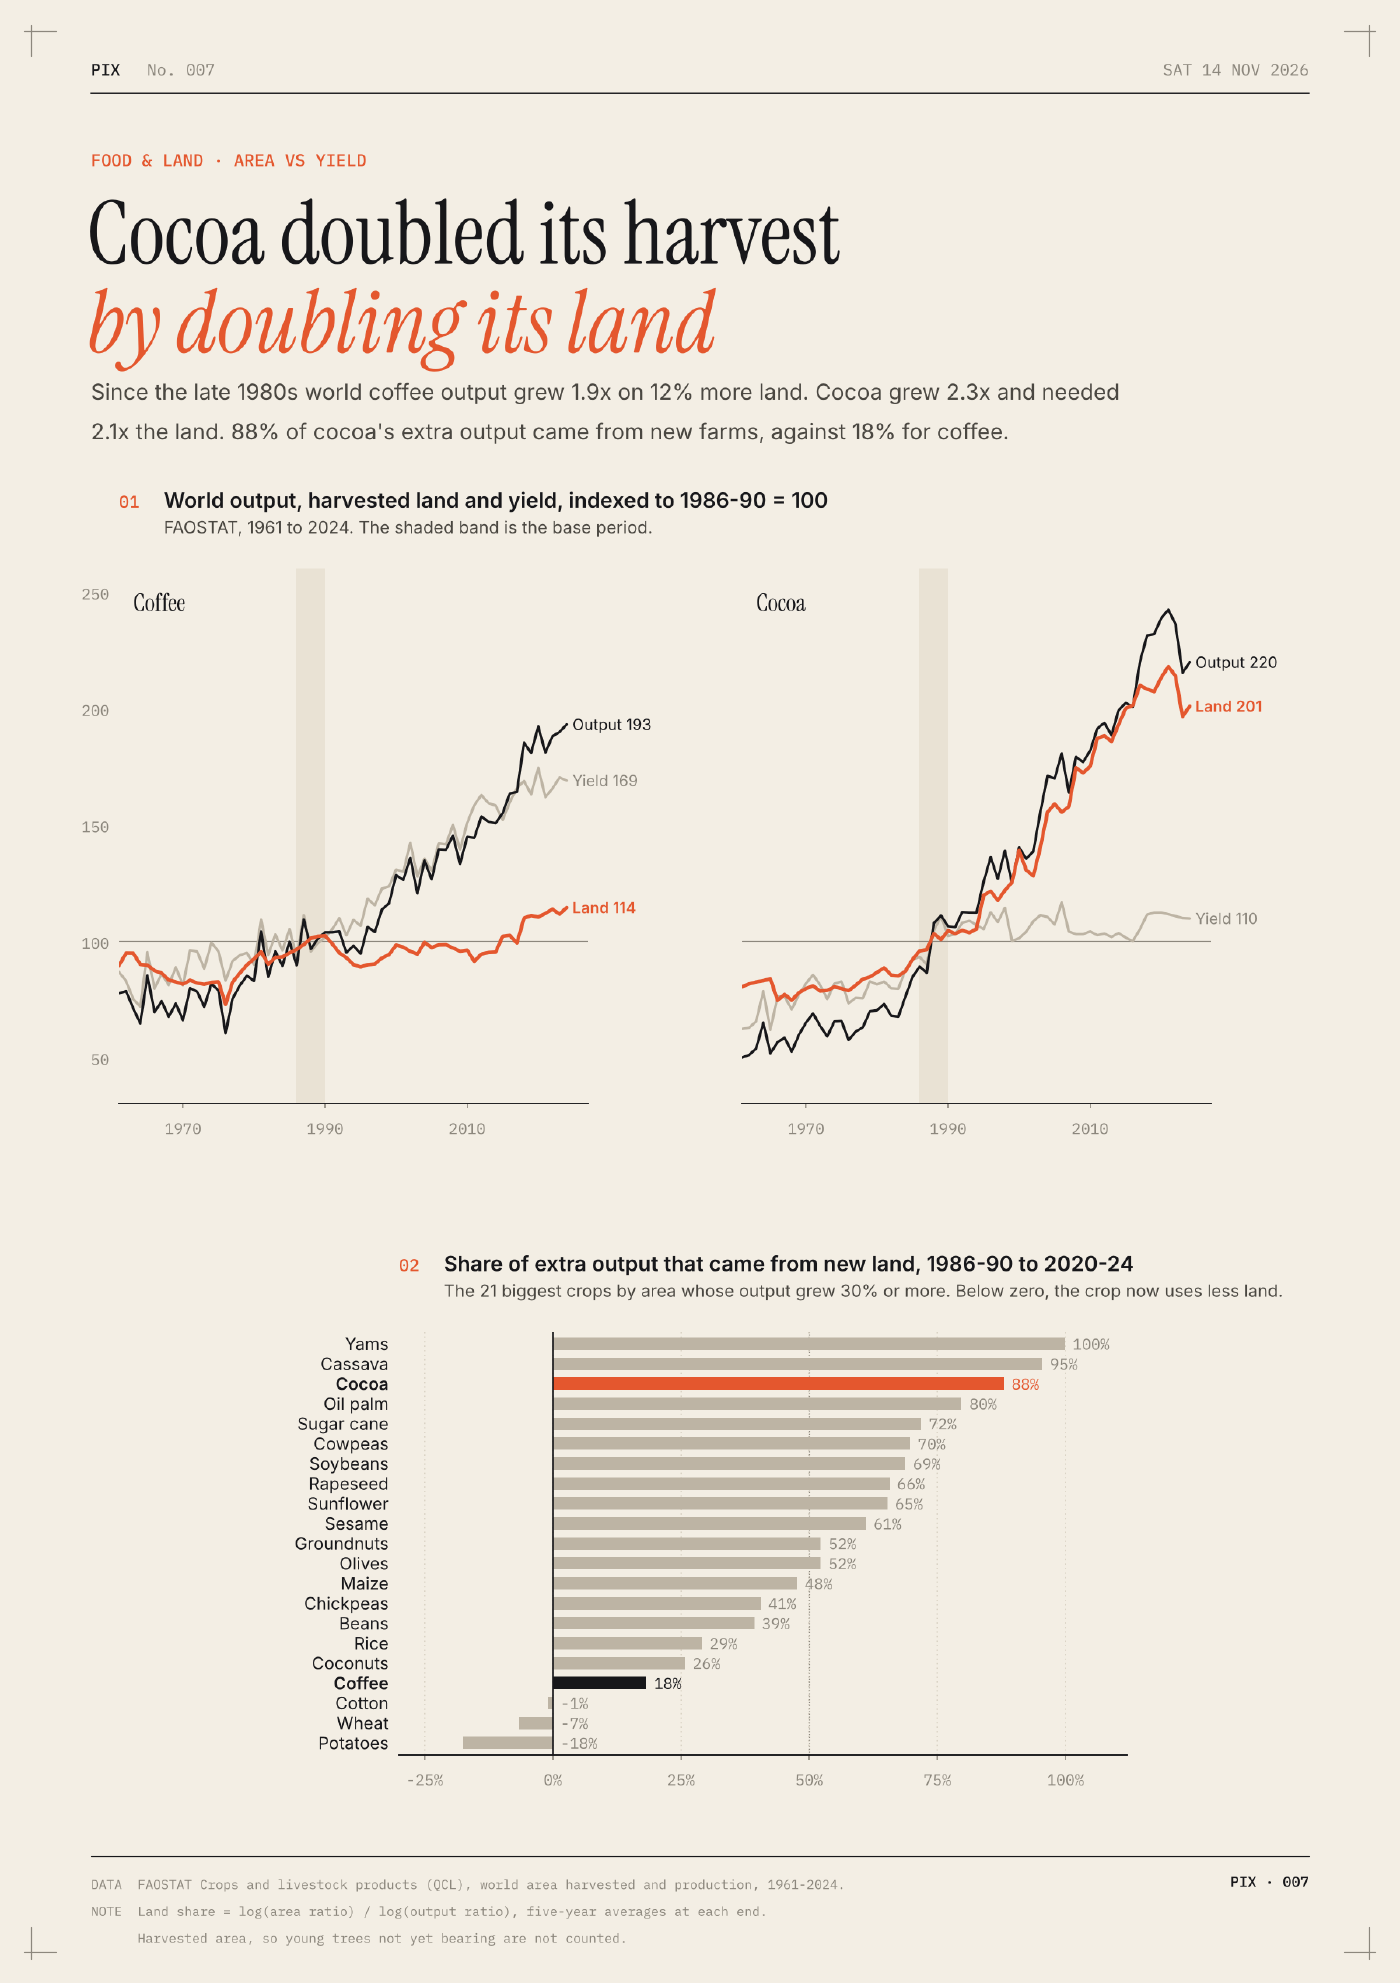
The first entry went up on November 8. A few from the first week:
- Four earthquakes released half this century’s quake energy. Of 3,996 magnitude 6+ quakes since 2000, the top four released 49% of the energy.
- The world’s clocks run fast. For most people the sun peaks after noon, not at it. 38% see it at 12:30 or later.
- Last year the world added a South Korea of solar power. New solar in 2025 made 636 TWh, about as much as South Korea’s entire electricity output.
The brief is the product
Most of the work went into CLAUDE.md, the standing brief the agent reads every morning. The model already knows how to use pandas and matplotlib. What it needs is taste, written down.
So the brief asks for one claim per post, stated as a sentence with a verb (“The world’s clocks run fast”), not a topic label (“Time zones of the world”). It lists the routes to an original angle: a question nobody asks, the agent’s own computation rather than a replotted chart, a re-weighting (count people, not countries), or a join of two datasets that rarely meet. And it has a first-idea test: if this is the first topic a newsroom or an AI would pick, drop it or push the angle two steps further.
The easy way for a model to be interesting is to be interesting in the most average way possible. Two of the first five posts were shaped “X% of people…”, so the brief now calls that out as the house habit, and every entry has to declare a claim type (share, concentration, gap, reversal, crossover, and a few others), with limits on how often any one type can repeat.
Make the checks executable
Asking a model to be original doesn’t do much on its own. Before writing any analysis code, the agent has to run at least five web searches, name the closest existing take, say what its version adds, and write down what a smart reader would naively predict. That goes in a prior_art.md file, and scripts/publish.py refuses to publish an entry without one.
Accuracy works the same way. Every number in a post has to come from the output of the entry’s analysis.py, which is saved next to the raw data, so each analysis reruns offline and anyone can check the work.
One house style
The charts share a style called Plate: a printed plate read on a screen. Warm paper, black ink, one vermilion colour for the thing to look at, and crop marks in the corners, with Instrument Serif headlines, Inter for words, and IBM Plex Mono for numbers. It lives in one Python module, so the agent assembles a chart from parts (plate(), masthead(), headline(), panel(), footer()) instead of fighting matplotlib’s defaults every morning. The plate stays the same while the chart form changes from day to day.
A voice
The brief also says how to write: first person, point first, numbers second, at most one dry line per post. It bans a list of words (striking, notably, delve, tapestry, and friends), em dashes, and section headers like “Key takeaways”. It’s a small thing, but it’s most of the difference between something that reads like a person and something that reads like a press release.
Everything is public: the brief, the style module, and the code and data behind every chart. The archive has every entry so far.