
Recently I was asked if I could add to {rtweet} some basic functions for converting Twitter data into network data objects. I thought this was a reasonable request and a good opportunity for me to learn more about network analysis. But the task of converting Twitter data into network-friendly objects is something that has, at least for me, been really slow and inefficient. So, for the past several weeks, I’ve been slowly working toward what I think believe a simple but efficient solution. Hence, the purpose of this blog post is to document what I’ve done.
The problem
The ultimate task at issue is converting Twitter data1 into a network or network-friendly data
object. Thus, the immediate problem is quickly and efficiently unrolling the connections (e.g.,
mentions) from one user to zero or more other users. In other words,
the problem is figure out how to convert this recursive data frame:
#> # A tibble: 163 x 2
#>    user_id mentions_user_id
#>    <chr>   <list>
#>  1 5685812 <chr [1]>
#>  2 5685812 <chr [2]>
#>  3 5685812 <chr [1]>
#>  4 5685812 <chr [1]>
#>  5 5685812 <chr [2]>
#>  6 5685812 <chr [1]>
#>  7 5685812 <chr [1]>
#>  8 5685812 <chr [1]>
#>  9 5685812 <chr [1]>
#> 10 5685812 <chr [1]>
#> # … with 153 more rows
into a desired output (with from and to-like columns) that looks something like this:
tibble::as_tibble(unroll_connections2(d))
#> # A tibble: 220 x 2
#>    from    to
#>    <chr>   <chr>
#>  1 5685812 2973406683
#>  2 5685812 215035672
#>  3 5685812 1051975721885798402
#>  4 5685812 1015516068717170688
#>  5 5685812 2801252524
#>  6 5685812 15184835
#>  7 5685812 260399941
#>  8 5685812 17581779
#>  9 5685812 870078805381132288
#> 10 5685812 4069028055
#> # … with 210 more rows
Pure R code (slowest)
The first function I wrote to accomplish this task leveraged data.frame logic (each column should be
the same length) to coerce the from column (user_id) to be of equal length as the
to (mentions_user_id) column for each row of the input data set. It then collapses
everything into a single data frame.
unroll_connections1 <- function(.x) {
  fun <- function(from, to) {
    ## if NULL or 1 missing value then return empty tibble
    if (length(to) == 0 || (length(to) == 1 && is.na(to[1]))) {
      return(data.frame())
    }
    ## return as tibble
    data.frame(from = from, to = unlist(to, use.names = FALSE),
      stringsAsFactors = FALSE)
  }
  .x <- mapply(fun, .x[[1]], .x[[2]], USE.NAMES = FALSE)
  do.call(rbind, .x)
}
The above code is slow and inefficient because it calls data.frame() (and all its associated baggage)
for every row of the input data.
Pure R code (faster)
My next iteration was also written in pure R code. To minimize the effect of so many data.frame() calls,
the function below calculates the number of times it needs to repeat the from value (to match the
number of times to values appear) and then combines everything at the end into a data frame.
As the benchmarking results later on confirm, this function offers a sizable speed up over the
original, data.frame()-heavy function!
unroll_connections2 <- function(x) {
  ## initialize logical (TRUE) vector
  kp <- !logical(nrow(x))

  ## measure [and record] length of each 'to' field (list of character vector)
  n <- lengths(x[[2]])
  n1 <- which(n == 1)

  ## if length == 1 & is.na(x[1])
  kp[n1[vapply(x[[2]][n1], is.na, logical(1))]] <- FALSE

  ## crate 'from' and 'to' vectors
  from <- unlist(mapply(rep, x[[1]][kp], n[kp]), use.names = FALSE)
  to <- unlist(x[[2]][kp], use.names = FALSE)

  ## return as data frame
  data.frame(
    from = from,
    to = to,
    stringsAsFactors = FALSE
  )
}
Rcpp code (fastest)
I was happy with the large speed up from unroll_connections2(), but I’ve also been trying to learn how
to speed up my code with c++, so I decided to see what kind of additional speed up I could get via
{Rcpp}.
#include <Rcpp.h>

using namespace Rcpp;

// [[Rcpp::export]]
List unroll_connections3(CharacterVector from, std::vector<std::vector<std::string>> to) {
  //# set size paramaeters (exclude NAs from the 'to'-based output count)
  const int n = from.size();
  int len = 0;
  for (int i = 0; i < n; i++) {
    if (to[i][0] != "NA") {
      len += to[i].size();
    }
  }
  //# use calculated lengths to initialize output character vectors
  CharacterVector from2(len);
  CharacterVector to2(len);

  //# for each value of the 'from' vector, create appropriately re-sized from2
  //# and to2 vectors
  int ctr = 0;
  for (int i = 0; i < n; i++) {
    int nn = to[i].size();
    for (int j = 0; j < nn; j++) {
      if (j == 0) {
        if (to[i][j] != "NA") {
          from2[ctr] = from[i];
          to2[ctr] = to[i][j];
          ctr += 1;
        }
      } else {
        from2[ctr] = from[i];
        to2[ctr] = to[i][j];
        ctr += 1;
      }
    }
  }
  //# combine the new [flat] vectors into a data frame (requires row names)
  List df = List::create(_["from"] = from2, _["to"] = to2);
  df.attr("class") = "data.frame";
  df.attr("row.names") = seq(1, ctr);
  return df;
}
bench::mark()
To compare the three previously described functions, I’ve used the {bench} package. The code and numeric results are printed below.
## from and to vectors
from <- d$user_id
to <- d$mentions_user_id

## perform bench mark
m <- bench::mark(
  unroll_connections1 = unroll_connections1(d),
  unroll_connections2 = unroll_connections2(d),
  unroll_connections3 = unroll_connections3(from, to),
  relative = TRUE,
  min_iterations = 100
)

## print results
m %>%
  dplyr::select(expression:n_gc) %>%
knitr::kable(digits = 2)| expression | min | mean | median | max | itr/sec | mem_alloc | n_gc |
|---|---|---|---|---|---|---|---|
| unroll_connections1 | 472.14 | 462.66 | 460.84 | 51.76 | 1.00 | 17.78 | 21 |
| unroll_connections2 | 7.19 | 7.08 | 6.85 | 1.00 | 65.32 | 631.74 | 6 |
| unroll_connections3 | 1.00 | 1.00 | 1.00 | 1.26 | 462.66 | 1.00 | 1 |
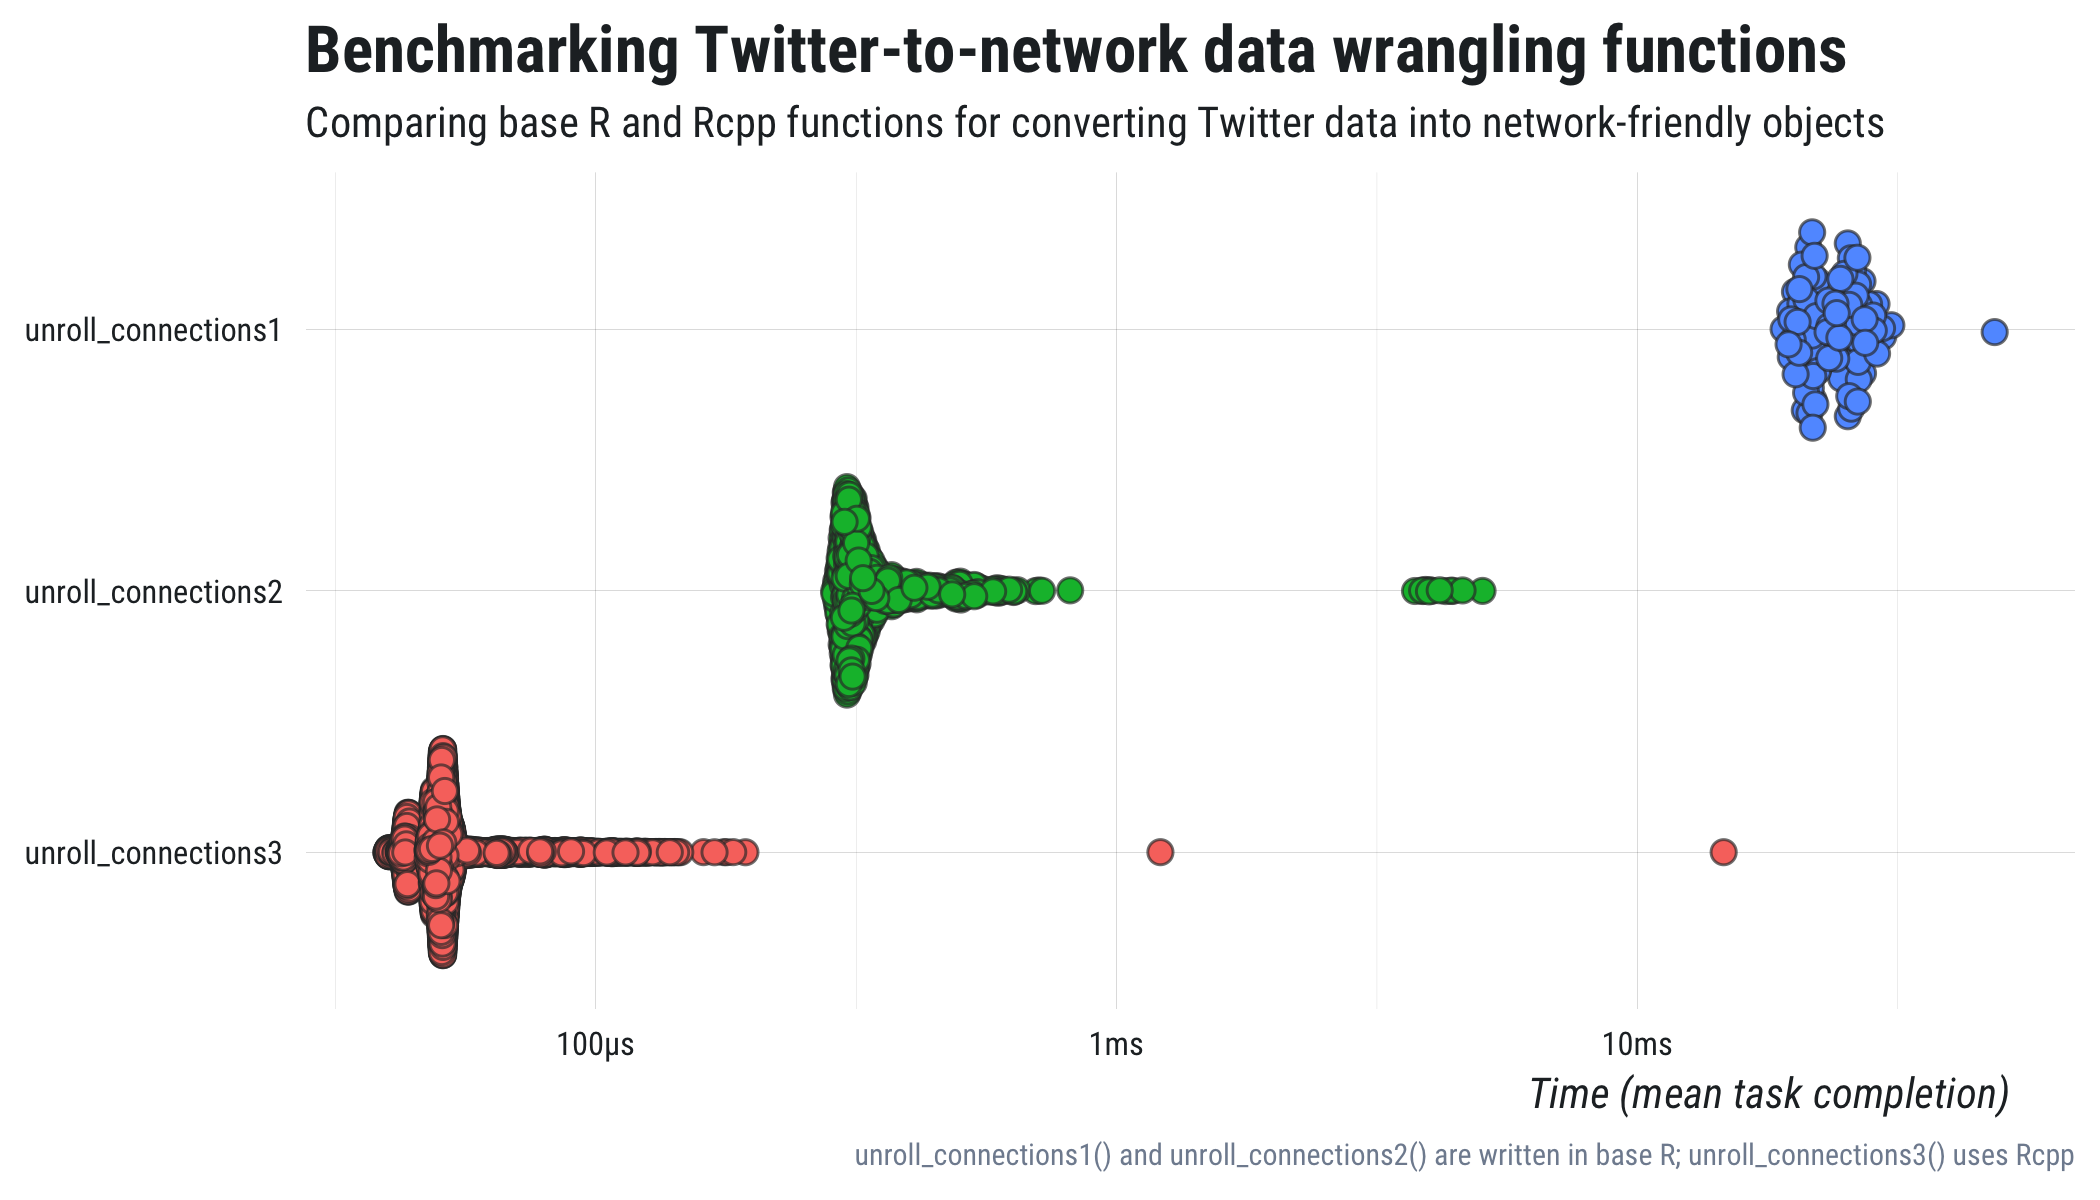
As you can see, the initial improvement from unroll_connections1() to unroll_connections2()
was more than 60X, which is great. But, thanks to the power of {rcpp}, I was able to speed things up even more with an improvement from
unroll_connections2() to unroll_connections3() of roughly 7X or roughly
450X compared to the original function!!
## plot
m$expression <- factor(m$expression, levels = rev(m$expression))
bench:::autoplot.bench_mark(m, shape = 21, size = 2.5, color = "#333333aa") +
  ggplot2::aes(fill = expression) +
  dataviz::theme_mwk() +
  ggplot2::theme(legend.position = "none",
    plot.caption = ggplot2::element_text(family = "Roboto Condensed")) +
  ggplot2::labs(x = NULL, y = "Time (mean task completion)",
    title = "Benchmarking Twitter-to-network data wrangling functions",
    subtitle = "Comparing base R and Rcpp functions for converting Twitter data into network-friendly objects",
    caption = "unroll_connections1() and unroll_connections2() are written in base R; unroll_connections3() uses Rcpp") +
  ggplot2::ggsave(here::here("content", "post", "img", "network-benchmark.png"),
    width = 7, height = 4, units = "in")
Notes
1 Data I used to generate the example data set:
## search for up to 200 #rstats tweets from verified users
rt <- rtweet::search_tweets("#rstats filter:verified", n = 200)

## select only the node (ID/screen name) variables
d <- dplyr::select(d, user_id, mentions_user_id)